
Many office commuters have a theory about Tuesday: it is the day everyone decides to come in. We tested that theory against ParkRide Planner's 12-week weekday pattern through 24 August 2026 across the NSW Park & Ride network.
Tuesday leads the weekday pattern
The chart below gives each car park one equal vote, then averages its typical percentage occupied at 8am. This stops a very large car park dominating the result simply because it has more spaces.
Tuesday is not always busiest: Tallawong P1 usually reaches its practical-full threshold earliest on Monday, while North Rocks was fractionally fuller at 8am on Wednesday.
| Weekday | Occupied at 8am | Practical full by 8am | Practical full by 9am |
|---|---|---|---|
| Monday | 72.8% | 17 of 39 | 23 of 39 |
| Tuesday | 79.9% | 22 of 39 | 27 of 39 |
| Wednesday | 77.5% | 19 of 39 | 27 of 39 |
| Thursday | 76.2% | 19 of 39 | 26 of 39 |
| Friday | 56.2% | 5 of 39 | 13 of 39 |
Tuesday's lead is strongest before 8am. By 9am, Tuesday and Wednesday are tied: 27 of the 39 car parks are typically practically full by then. The data support “Tuesday is usually busiest”, but not “every Tuesday is worse than every Wednesday”.
Almost everywhere does not mean everywhere
At 8am, Tuesday had the highest or tied-highest typical occupancy at 38 of 39 car parks. It was the sole highest day at 23 of 39. North Rocks was the only exception, with Wednesday at 66.9% occupied and Tuesday at 65.5%.
Practical-full times tell a similar story. Of the 28 car parks with a typical full time on at least one weekday, Tuesday was earliest or tied-earliest at 27. Tallawong P1 was the exception: its Monday pattern crossed the practical-full threshold at 6:00am, compared with 6:15am on Tuesday.
Narrabeen was a genuine tie, reaching the threshold at 7:17am on both Tuesday and Wednesday. These small exceptions are why ParkRide Planner keeps a separate weekday pattern instead of applying a single network rule.
The busiest day depends on the car park
The Plan view is more useful than the network average because it compares the car parks a commuter actually uses. The sample below shows typical practical-full times for several car parks.
| Car park | Mon | Tue | Wed | Thu | Fri |
|---|---|---|---|---|---|
| Tallawong P1 | 6:00 | 6:15 | 6:45 | 6:24 | 7:02 |
| Hills Showground | 7:34 | 7:02 | 7:11 | 7:19 | 8:31 |
| Gosford | Open | 7:46 | 8:41 | 9:16 | Open |
| Kellyville South | 8:38 | 7:49 | 8:07 | 8:11 | Open |
| Bella Vista | 9:00 | 7:51 | 8:04 | 8:00 | Open |
| North Rocks | 8:35 | 8:17 | 8:19 | 8:30 | Open |
| Beverly Hills | Open | Open | Open | Open | Open |
“Open” means the typical curve did not reach ParkRide Planner's practical-full threshold during the observed day. It is not a guarantee that spaces will always remain.
Why Plan is weekday-specific
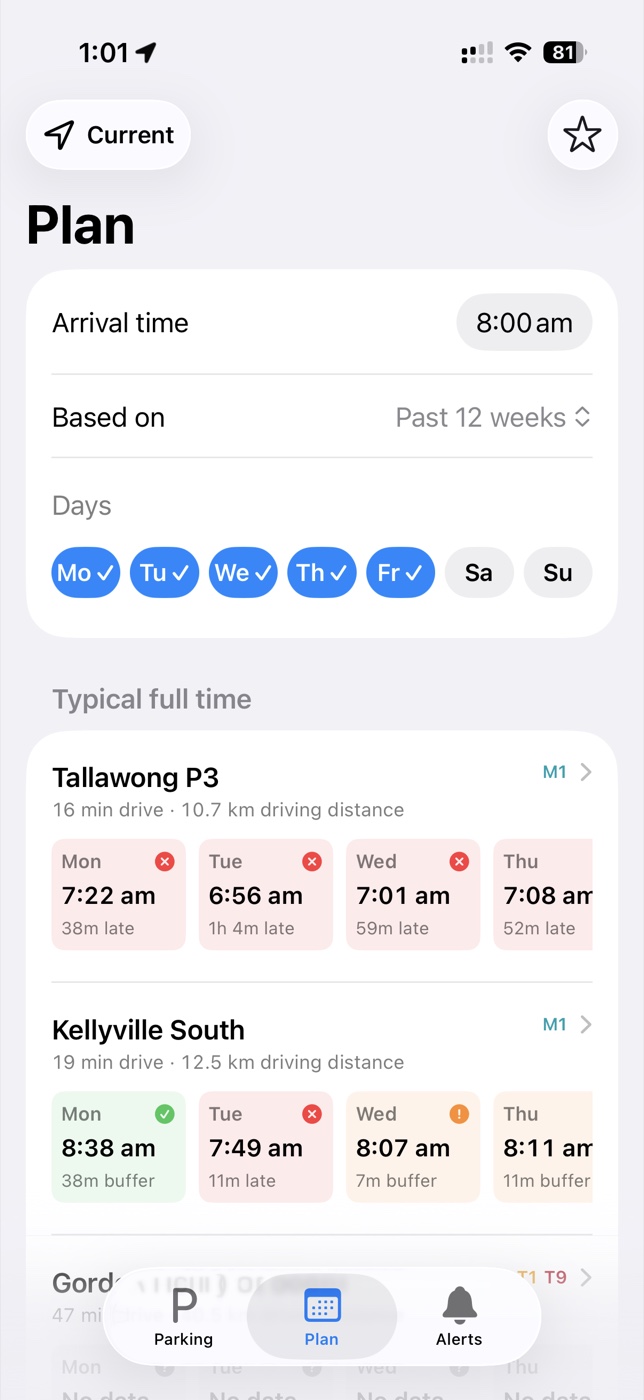
One arrival time can produce five different answers.
Choose your usual arrival time and ParkRide Planner compares Monday to Friday using recent matching weekdays. This exposes patterns such as Kellyville South moving from 8:38am on Monday to 7:49am on Tuesday, then remaining typically open on Friday.
The app uses the same 12-week normal-term pattern as this article, while the live Parking view shows what is happening today.
What this means for commuters
- Allow more time on Tuesday. If you can choose an office day or departure time, Tuesday is the day to arrive earlier.
- Do not assume Monday is always easier. Tallawong P1 is a clear exception, and individual car parks can follow a different pattern from the network.
- Wednesday is close. By 9am, just as many car parks are typically constrained on Wednesday as on Tuesday.
- Friday is much quieter. Its average 8am occupancy was more than 20 percentage points below Tuesday, and only 13 car parks were typically practically full by 9am.
Tuesday is a useful default, but your usual car park may follow a different pattern.
How we tested it
This analysis uses the same 12-week Plan pattern as the app, with data through . It covers 39 car parks with at least four valid examples for every weekday at 8am. ParkRide Planner now supports 41 car parks. This dated comparison excludes Gordon South, which was added on 11 August and had too little normal-term history for the study, and Mount Druitt, which was added later in September.
- Normal-term pattern: NSW public holidays and NSW school holidays are excluded, matching the app's current default.
- Busiest at 8am: the weekday with the highest median percentage occupied at each car park.
- Network average: each car park counts equally. The result averages their median occupancy percentages rather than adding their spaces together.
- Practically full: the app's capacity-adjusted threshold, held for long enough to show a tight car park rather than one noisy reading.
- Ties: weekdays share the result when the underlying typical values are equal.
A known boom-gate industrial-action period affected six Northern Beaches car parks during June and July. We repeated the analysis without those six car parks. The conclusion did not change: Tuesday remained highest or tied-highest at 32 of the remaining 33 car parks, and earliest or tied-earliest at 21 of the 22 car parks with a typical full time.
Limitations: these are past patterns, not guarantees for a future morning. Transport for NSW sensor counts can occasionally drift or be corrected. The 8am comparison captures a common commuter arrival time, but a different time can change the ranking at an individual car park.
Sources and disclosure
- Transport for NSW Open Data: Car Park API, the source of parking availability observations stored and analysed by ParkRide Planner.
- ParkRide Planner weekday-analysis dataset, generated by a reproducible read-only script with zero database writes.
- Which Sydney Park & Ride car parks really fill before 9am?, the related full-network timing analysis.
ParkRide Planner is an independent iPhone and Apple Watch app using publicly available Transport for NSW data. It is not affiliated with or endorsed by Transport for NSW.